The Problem
Existing reporting tools provided by the theater software were difficult to access remotely, lacked historical analytics, and did not expose many of the metrics I wanted to track. I wanted a centralized platform that could aggregate ticket sales, occupancy data, showtimes, and historical trends while remaining accessible from any device.

Ticket sales dashboard displaying real-time sales, occupancy metrics, and movie performance across multiple theater locations.
Project Scale
- 526 unique movies tracked
- 185,000+ showing records
- 861MB database
- 8 theater locations
- Hundreds of showings processed per update cycle
- Hundreds of API requests per synchronization run
Features
- Tracks movie sales data
- Accessible anywhere (web-based)
- Provides more features than existing business tools
- User-friendly interface
- Regular updates and improvements
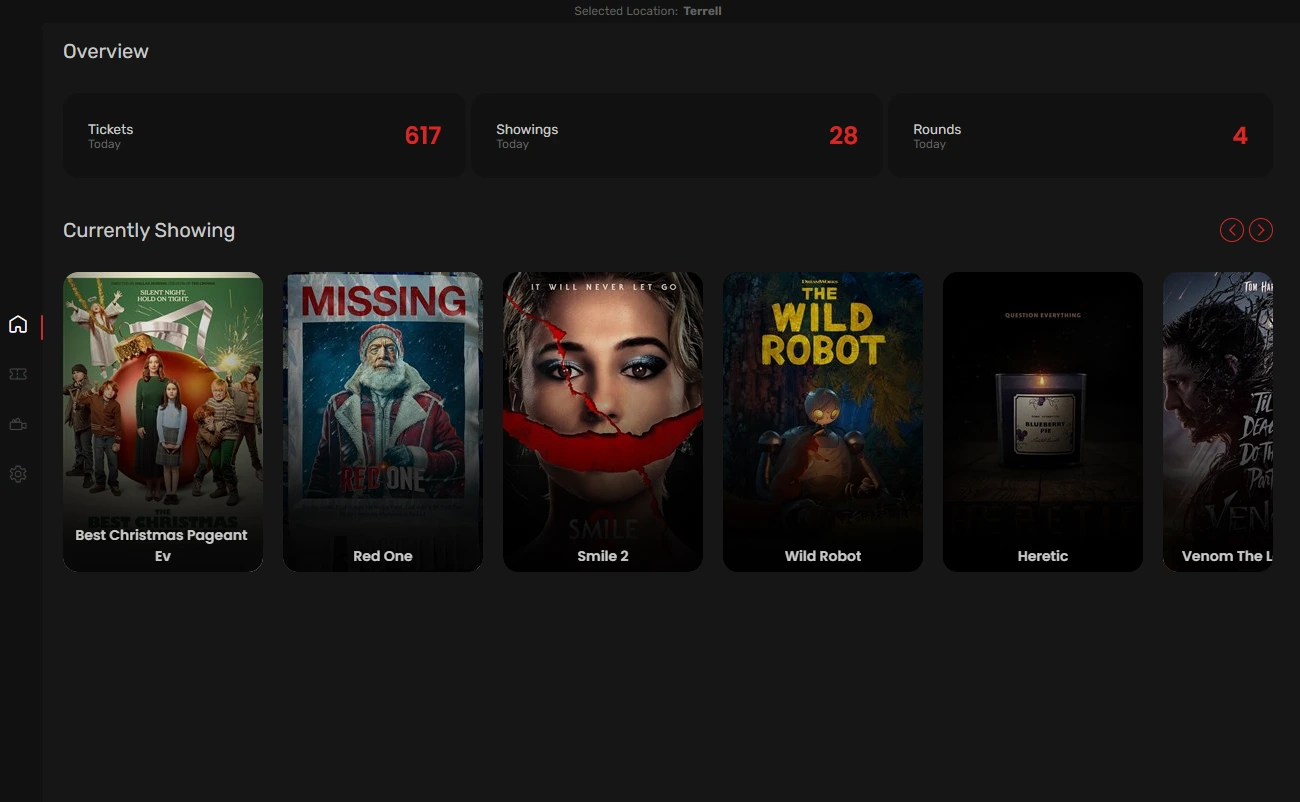
Overview dashboard displaying aggregated movie sales, occupancy, and showtime data
Technologies Used
The frontend was intentionally developed without a framework in order to better understand routing, state management, and component architecture, such as several popular SPAs (Single Page Applications). The project is built from scratch to cater to and help myself better understand the underlying processes.
- Web-based platform (HTML, CSS, JavaScript)
- TypeScript
- Node.js
- Express.js
- MySQL
- Auth0 (Authentication)
- Stripe (No longer used)
- Multi-server architecture
System Architecture
When I say multi-server architecture I mean I have separated the frontend for users from the web-scraping backend to ensure users have a seamless experience without being affected by the backend processes. This setup allows the frontend to remain responsive and available even when the backend is performing intensive data collection tasks.
*Just to get everything straight, every time I refer to the "backend" I mean the web-scraping server that handles data collection and processing, separate from the user-facing frontend.*
At the moment, the project is split between 2 separate servers: the frontend server that handles user interactions and the backend server that handles web scraping and data processing. This was not originally the case, as initially both frontend and backend functionalities were handled by a single server, which often led to performance bottlenecks and a less responsive user experience. I had noticed the web scraping times were not only increasing but it was starting to affect the user experience by making a slower frontend and sometimes it stopped responding entirely. These 2 servers were linked through private networking to ensure secure and efficient communication between them. While the private network wasn't necessarily required, it provided an added layer of security and performance optimization.
Users
  ↓
Frontend Server
  ↓
MySQL Database
  ↑
Scraping Backend
  ↑
RTS APIs
Challenges
- Puppeteer Performance: Web scraping with Puppeteer on a single server caused noticeable slowdowns, affecting the responsiveness of the frontend.
- Database Growth: The database was growing rapidly, which could potentially impact query performance and overall system responsiveness.
- Scalability: As the number of theaters and showings increased, the system needed to scale efficiently to handle the growing data volume and user requests.
- Single Server Bottlenecks: Having both frontend and backend processes on a single server led to performance bottlenecks, affecting the responsiveness of the user interface.
Optimizations
Multi-threading (not multi-processing)
This distinction is important because JavaScript, being single-threaded by nature, does not benefit from multi-processing in the same way as multi-threading can improve concurrent execution within the same process. This was also a key factor in switching to a multi-server architecture instead of just upgrading the single server's hardware capabilities.
Initially, the backend would update the showings sequentially. As almost every programmer knows, this introduces significant bottlenecks especially when handling unreliable networking requests. This was originally noticed when a singular showing was causing the entire cycle to slowdown. This was the case because if there were any incorrect formatting or errors in the listing, it would take the entire 30 second timeout before it continued to the next showing. With several of these present in the entire cycle this alone increased the total time by several minutes per update cycle.
By implementing multi-threading, the backend was able to process multiple showings concurrently, significantly reducing the time taken for each update cycle and preventing a single slow or erroneous showing from blocking the entire process.
Frontend Request Caching
Another issue was beginning to take place with the addition of another 20 user accounts accessing the frontend simultaneously. The database was beginning to slow down and the response times were increasing noticeably. This was also starting to affect the backend scraping service. To mitigate this, frontend request caching was implemented, reducing the load on the database and improving response times for users. Since the most common frontend request was asking for ticket data for the current day and a list of all the movies and their data, caching these responses significantly reduced the number of direct database queries, thereby enhancing overall performance. Caching has its benefits but also its drawbacks. Since cached data may not always reflect the most current state of the database, there is a trade-off between performance and data freshness. Although the idea was to reduce the amount of times the database is hit for very similar requests, there was another problem arising with the time between cache updates, potentially serving significantly outdated information to users. To address this, the users frontend JavaScript now also caches the same data the server is already caching i.e. there was no reason to update the movie list more than once in the duration of the current users session since new movie listings are introduced about once per week.
Database Optimizations
Seat Data Optimization
With the addition of viewing which seats were sold for every showing, the size of the database began to increase significantly. The amount of data stored for each seat included the seat's ID, position, size, group, type, multi-asset flag, asset ID, row, seat number, row and column indices, text color, description flag, sold status, overlay ID, and seat flag. Much of this information was needed but not all was necessary. There were several techniques used to create this optimization. Since most of data provided was redundant or could be inferred, it was possible to significantly reduce the storage requirements per seat such as removing the key name. The row and seat number "id" could be combined into a single identifier, reducing the number of fields stored and simplifying data retrieval. The size and position of the actual seat "p" could be stored as an array rather than separate fields, further reducing the data footprint. The final identifier "s" represents 3 different status flags: sold status, handicap, and broken. This is a bitwise representation. Since there are only 3 different flags it only requires 3 bits to store these values meaning a single number could represent 3 boolean values.
0: None (000)
1: Sold (001)
2: Handicap (010)
4: Broken (100)

3: Sold + Handicap (011)
5: Sold + Broken (101)
6: Handicap + Broken (110)
7: Sold + Handicap + Broken (111)
With these optimizations, the data stored for each seat is significantly reduced, making the database more efficient and easier to manage. The original size of each seat was 290B or 0.28KB. After optimization it drops to 41B or 0.04KB with a reduction of approximately 85%. While the actual size difference may vary depending on the specific data, the overall impact is substantial dropping the overall database size from ~900MB to ~150MB. This savings was important if I wanted to implement more locations for showings.
{"ID": 2637,"x": 4119,"y": 2457,"w": 500,"h": 678,"g": 1,"t": 0,"multi": false,"assetID": 38,"row": "A","seat": "8","r": 1,"c": 8,"textForeColor": -1,"showDescOnApp": true,"sold": false,"overlayId": 2,"isSeat": true}
{"id":"A8","p":[4119,2457,500,678],"s":0}
This can further be optimized by removing keys entirely and relying on positional data, reducing the storage footprint even more. Although I chose not to implement this step in the current version for ease of understanding and maintainability, it remains a viable option for future optimization. If this were implemented, it would drop the size of each seat to approximately 28B or 0.03KB.
["A8",[4119,2457,500,678],0]
Frontend Architecture
I intentionally avoided frontend frameworks during the initial development phase in order to better understand routing, state management, DOM updates, and component architecture. As the project grew, many patterns naturally evolved toward SPA concepts such as client-side routing and reusable UI components. This shows why SPA frameworks are so popular in modern web development.
The primary modulation of the frontend codebase is organized into Components, Modules, Pages, and Utilities, each serving a distinct purpose to maintain a clean and manageable structure. Components generally contain reusable UI elements used across multiple pages such as custom dropdown menus and toggle switches. Modules encapsulate functionality that is also shared between all pages such as the caching and API interactions meaning these are loaded and running at all times. Pages represent the different views within the application and the specific logic and layout associated with each view. Utilities, as you can imagine, are several helper scripts or third-party tools such as Chart.js and Moment.js.
public
    └── js
        └── Components
        └── Modules
        └── Pages
        └── Utilities
        └── router.js
    └── Pages
    └── Styles
    └── app.html
Router
Perhaps the most complicated part of this structure is the router, which manages navigation between different pages and ensures that the correct modules and components are loaded as needed. This is the primary component responsible for maintaining the SPA-like behavior and ensuring a seamless user experience. It handles route matching, view loading, navigations updates, and browser history management. It supports static routes and dynamic parameter routes (for example, movie detail pages with IDs).
At startup, the router initializes shared modules (settings, tickets, theater sizes, locations, and notifications), pulls the saved startup page from settings, and inserts that page's HTML into the app.html DOM. It also applies location context to the footer and refreshes ticket data when the selected build/location changes.
Why This Router Is Reusable
- Route definitions are centralized in a single map, making it easy to add or remove pages.
- Views follow a simple contract (
getHtml, optional insertion callback, selected nav update), so each page module stays independent. - Dynamic params are handled generically with route patterns like
:id, which avoids hard-coding page-specific parsing. - Link handling is automatic for any element marked with
data-link, including links inserted later through DOM updates. - The request ID guard prevents stale async page loads from overwriting newer navigation, which is critical for reliability.
- Global and page-level callbacks are separated, allowing shared UI behavior without coupling every page to the same logic.
This keeps the frontend modular, predictable, and easy to scale as more pages and features are added.
The Server Serving the Frontend
The frontend is served by a lightweight Express application focused on static asset delivery, API routing, and model management. It handles static file delivery and API requests in a straightforward manner, without any complex routing or middleware logic. The most routing and middleware used is primarily for serving static files and handling basic API endpoints. Perhaps the most interesting part is how the server manages the Models of the application, ensuring that data is correctly retrieved, updated, and persisted as needed. Most items are cached to ensure there are minimal database hits and improved performance. They generally compare the new and old properties to determine if there are actual changes before committing updates to the database. For fetching data, it allows multiple different properties to be given and one or more results may return.
Security (Auth0)
The application uses Auth0 for authentication and authorization, ensuring that only authenticated users can access protected resources. Auth0 handles user login, token issuance, and session management, providing a secure and standardized approach to user authentication. Auth0 was chosen for its simplicity and ease of integration, allowing me to implement robust authentication without building a custom solution from scratch.
Data Collection Pipeline
The backend maintains its dataset through an automated synchronization process that runs continuously in the background.
1. Schedule Collection: The system loads configured theater locations and periodically retrieves active movies and showtimes from the theater scheduling API. Incoming data is normalized into a consistent internal format to simplify downstream processing.
2. Movie Processing: Movies are matched against existing records and automatically created when new titles are discovered. Metadata such as runtime, ratings, trailers, release dates, and posters are stored, while poster artwork is enhanced using higher-quality images from TMDB when available.
3. Showing Synchronization: A complete in-memory dataset of active showings is built and compared against existing database records. New showings are created, existing records are updated, and canceled showings are automatically removed to keep the database synchronized with the source system.
4. Ticketing & Seat Data Collection: Each active showing is queried for detailed ticketing information including ticket sales, theater capacity, seat locations, accessibility seating, and premium formats. Requests are processed through a controlled task queue to avoid overwhelming external services.
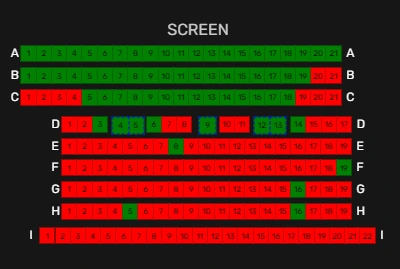
5. Seat Map Optimization: Raw seat data is transformed into a compact representation before storage. Seat position, availability, accessibility, and maintenance status are preserved while reducing storage requirements and improving frontend rendering performance.
6. Analytics & Validation: The system automatically detects premium formats, validates theater capacities, updates occupancy metrics, and maintains supporting metadata used throughout the application.
7. Database Update & Monitoring: All collected information is synchronized asynchronously to the database, allowing hundreds of showings to be processed concurrently. Performance metrics such as request counts, average response times, and update durations are logged for monitoring and troubleshooting.
Result:
This pipeline produces a continuously updated dataset containing movies, showings, ticket sales, seat maps, occupancy metrics, and theater metadata, allowing users to access near real-time theater analytics through a web-based interface.
General Structure
As the size of the database grew, the need for a more efficient general structure became apparent. At first there were very basic techniques used in terms of data organization and storage, but as the database continued to expand, more sophisticated methods were required to maintain performance and manageability. Aside from the concept phase when everything was just in a single JSON file, I needed a way to better organize the data. I began to research more into relational databases. At first the database was structured in a flat manner, with all data stored in large, monolithic tables. This approach quickly became inefficient as the volume of data increased, leading to slower queries and more complex data management. Each location had its own table despite some of the very similar entries in each one. For example most locations were showing the exact same movies at the same time but had its own entry for each location. Although each table wasn't large in size at the time, it was clear that this approach would not scale well as more locations and showings were added.
terrell_showtimes
terrell_movie_list

bastrop_showtimes
bastrop_movie_list

georgetown_showtimes
georgetown_movie_list
As a result, I decided to normalize the database structure, separating showtimes and movie lists into distinct tables and linking them through relational keys. This approach reduces redundancy, improves query performance, and makes the database more scalable as additional locations and showings are added.
locations
    └── movie_locations
        └── movies
            └── showtimes
                └── showtimes_seats

theater_sizes
This introduced several new features including automatic theater size detection, improved data consistency, and more efficient querying capabilities. Especially with showtimes_seats being the largest table, it was more effective to split it off the showtime table especially since each showtime could have a large number of associated seats, and keeping them in a separate table allowed for more efficient storage and retrieval. Another benefit was the ability to do cross-location movie analytics since the movies are now centralized in a single table rather than being duplicated across multiple location-specific tables.
With all these optimizations now implemented, the database's size at the time of writing is 861MB. While this has grown from the original size when the seat optimization was introduced, keep in mind this is for over 185K showing entries and 526 unique movies with the timespan stretching back almost 3 years.
Another notable change within this structure was the locations table. This table holds very important information for both the frontend and backend of this application. Previously, all location-specific information was either hard-coded into the scraping scripts or had inconsistent representation across different parts of the system. By adding this table, all location data became centralized making it much easier to either modify, remove, or create an entire new location. Instead of trying to locate everywhere that needed modification, one could now simply update the locations table, and the changes would propagate throughout the system.
Web Scraping Benchmarks
Initial single-server setup with Puppeteer
With the limitations of JS and only running on a single core, web scraping caused noticeable slowdowns in the frontend, sometimes making either process unresponsive. I was seeing upwards of 10-20 minutes between updates for each location. With there being around 300 showings to process per run, this was clearly not sustainable as each showing was taking anywhere from 2-4 seconds to process. Even with optimizations, this would only take me so far in reducing the update times.
During the concept and v1 stages of the project, the actual scraping and request fetching library used was Puppeteer. Puppeteer was chosen for its ability to search and manipulate DOM content without searching through network requests or having to manually parse network responses. Another benefit of this was being able to take screenshots of seating charts for use later for the frontend users. The screenshotting mechanism was later replaced by data extraction from the API and recreation. Although the abilities Puppeteer provided were useful, the performance limitations of running virtual browsers began to show its sluggishness over time.
Multi-server setup with Axios
By separating the frontend and backend, I was able to make several more much needed improvements to the scraping and processing of each showing, resulting in significantly faster update times and a more responsive user experience.
Puppeteer was slowly phased out in favor of Axios, which allowed for faster and more efficient HTTP requests, reducing the time taken for each showing update significantly. Instead of combing through each page's HTML for the next link, Axios enabled direct API calls to fetch the required data, streamlining the entire process. I no longer needed several seconds per request to extract the necessary information, all it took was a single API call.
[Location] Request Statistics: 555 requests | Avg: 40ms | Quickest: 34ms | Slowest: 160ms

[Location] Completed updates in 44.759 seconds
As shown by the log taken directly from the actively running server, the time taken for updates has drastically reduced from 2-4 seconds per request to about 40ms per request with the help of multi-threading. This isn't just to scrape the data either, this is scraping, processing logic, and saving to the database.
What I Would Do Differently
- Implement a true SPA framework to handle frontend routing and state management more efficiently.
- Containerize the application to simplify deployment and ensure consistent environments across development, testing, and production.
- AWS deployment to leverage cloud infrastructure for scalability and reliability and LAMBDA Functions for serverless execution.
Key Takeaways
This project allowed me to gain practical experience with:
- Full-stack development
- Database design
- Performance optimization
- Distributed services
- Authentication systems
- Data synchronization
- Long-term application maintenance